ECAP
The ECAP class combines Ephys and Stim objects. Below is documentation for the ECAP class along with its parent class _EpochData.
- class pyeCAP.ecap.ECAP(ephys_data, stim_data, distance_log=None)
This class represents ECAP data
- __init__(ephys_data, stim_data, distance_log=None)
Constructor for the ECAP class.
- Parameters
ephys_data (_TsData or subclass instance) – Ephys data object.
stim_data (Stim class instance) – Stimulation data object.
distance_log (array of distances from recording electrode(s) to stimulating electrode [=] cm) –
- calculate_neural_window_lengths()
- Returns
time_windows[recording_electrode][fiber_type][start/stop]
- calculate_AUC(window_type='standard_neural', analysis_method='RMS', plot_AUC=False, save_path=None)
- save_path:
location to save plotting of AUCs
- window_type:
“standard_neural”: collects all data within entire range of neural window based on fiber type “standard_EMG”, “dynamic_neural” : detects max peak and leading/lagging minima; up to 25% out of current window for leading. “dynamic_EMG” : detects onset and offset
- analysis_method:
“RMS” for root mean square. “Integral” for integral
- plot_AUC :
Can chose to plot calculation of AUCs
- plot_recChannel_per_axes(condition, amplitude, stim_channel, relative_time_frame=None, display=False, save=False)
Plots all recording channels for a given condition, stimulation channel and amplitude. :param condition: Experimental Condition :param amplitude: Stimulation Amplitude :param stim_channel: Stimulation Channel :param relative_time_frame: Time frame in (s) to visualize :param display: Show figure :param save: Save figure
ECAP parent class
The _EpochData class is the parent class of the ECAP class. The ECAP class inherits all methods from this class. Methods in this class take one or more stimulation parameters as input. Stimulation parameters are tuples containing two integer indices for the data. The first integer represents the data set, and the second integer represents the stimulation period within the experiment. For example, the parameter (1,3) would refer to the fourth stimulation in the second experiment.
There are two main types of methods present in the _EpochData class: methods for working with the data as an array, and plotting methods.
Array Methods:
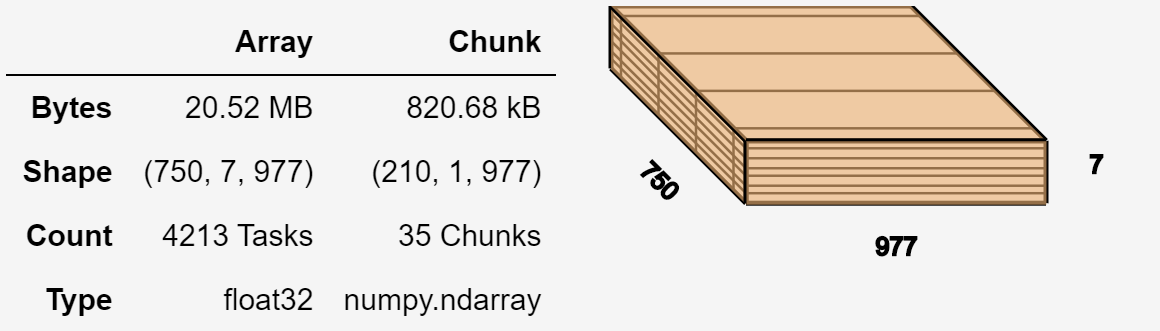
These Methods work with the data as a dask array or numpy array. With the Ephys class, arrays of the data were divided into two dimensions, one for data points and one for channels. The _EpochData class re-dimensions the array into three dimensions using the stimulation parameters. One dimension for channels, one for stimulation pulses, and one for data points. Each array is generated using one parameter and extra data is ignored. This means that each array only contains the data for one stimulation period within one experiment. All of the methods for working with arrays are wrapped with the functools.lru_cache decorator for faster computing.
Visualization of the dask array for one parameter. The ECAP object shown below has 7 channels, 750 pulses in the stimulation period, and 977 data points in one pulse.
Plotting Methods:
These methods help to visualize the relevant Ephys data.
- class pyeCAP.base.epoch_data._EpochData(ts_data, event_data, parameters, x_lim='auto')
Class representing Epoch Data and parent class of ECAP. Contains the methods for the ECAP class.
- __init__(ts_data, event_data, parameters, x_lim='auto')
Constructor for _Epochdata class.
- Parameters
ts_data (_TsData or subclass) – Time series or Ephys data.
event_data (_EventData or subclass) – Stimulation event data.
parameters (_ParameterData or subclass) – Stimulation parameter data.
x_lim (str) –
???
Array Methods
- time(parameter)
Returns an array of times starting at 0 seconds. These times correspond to times of data points from one pulse of the given parameter. The result is stored in a cache for faster computing.
- Parameters
parameter (tuple) – Stimulation parameter. Composed of index for the data set and index for the stimulation.
- Returns
Array of times of the data points.
- Return type
numpy.ndarray
Examples
>>> ecap_data.time((0,0))   # first stimulation of first data set
>>> ecap_data.time((0,1))   # second stimulation of first data set
- dask_array(parameter)
Returns an array of data points from the data set from the given parameter. The array will contain the Ephys data with one dimension representing the pulse and another representing the channel. The remaining dimension specifies the number of data points in each pulse/channel combination. The result is stored in a cache for faster computing.
- Parameters
parameter (tuple) – Stimulation parameter. Composed of index for the data set and index for the stimulation.
- Returns
Array
- Return type
dask.array.core.Array
Examples
>>> ecap_data.dask_array((0,0))
- array(parameter, channels=None)
Returns a numpy or dask array of the raw data with the specified parameter and channels. The array will contain the time series data with one dimension representing the pulse and another representing the channel. The remaining dimension specifies the number of data points in each pulse/channel combination. The result is stored in a cache for faster computing.
- Parameters
parameter (tuple) – Stimulation parameter. Composed of index for the data set and index for the stimulation.
channels (None, str, int, tuple) – Channels or channel indices to include in the array.
- Returns
Three dimensional array containing raw Ephys data.
- Return type
numpy.ndarray, dask.array.core.
Examples
>>> ecap_data.array((0,0), channels = ['RawE 1'])
- mean(parameter, channels=None)
Computes an array of mean values of the data from a parameter for each pulse across given channels. The result is stored in a cache for faster computing.
- Parameters
parameter (tuple) – Stimulation parameter. Composed of index for the data set and index for the stimulation.
channels (None, str, int, tuple) – Channels or channel indices to include in the array.
- Returns
Dask array if channels are specified, numpy array if no channels are specified.
- Return type
dask.array.core.Array, numpy.ndarray
Examples
>>> ecap_data.mean ((0,0), channels = ['RawE 1'])
- median(parameter, channels=None)
Computes an array of median values of the data from a parameter for each pulse across given channels. The result is stored in a cache for faster computing.
- Parameters
parameter (tuple) – Stimulation parameter. Composed of index for the data set and index for the stimulation.
channels (None, str, int, tuple) – Channels or channel indices to include in the array.
- Returns
Dask array if channels are specified, numpy array if no channels are specified.
- Return type
dask.array.core.Array, numpy.ndarray
Examples
>>> ecap_data.median((0,0), channels = ['RawE 1'])
- std(parameter, channels=None)
Computes an array of standard deviation values of the data from a parameter across each pulse for the given channels. The result is stored in a cache for faster computing.
- Parameters
parameter (tuple) – Stimulation parameter. Composed of index for the data set and index for the stimulation.
channels (None, str, int, tuple) – Channels or channel indices to include in the array.
- Returns
Dask array if channels are specified, numpy array if no channels are specified.
- Return type
dask.array.core.Array, numpy.ndarray
Examples
>>> ecap_data.std((0,0), channels = ['RawE 1'])
Plotting Methods
- plot(axis=None, channels=None, x_lim=None, y_lim='auto', ch_labels=None, colors=sns.color_palette(), fig_size=(12, 3), show=True)
Plotting method for ECAP data.
- Parameters
axis (None, matplotlib.axis.Axis) – Either None to use a new axis, or a matplotlib axis to plot on.
channels (int, str, list, tuple, np.ndarray) – Channels to plot. Can be a boolean numpy array with the same length as the number of channels, an integer array, or and array of strings containing channel names.
x_lim (None, list, tuple, np.ndarray) – None to plot the entire data set. Otherwise tuple, list, or numpy array of length 2 containing the start of end times for data to plot.
y_lim (None, str, list, tuple, np.ndarray) – None or ‘auto’ to automatically calculate reasonable bounds based on standard deviation of data. ‘max’ to plot y axis limits encompassing all accessible data. Otherwise tuple, list, or numpy array of length 2 containing limits for the y axis.
ch_labels (list, tuple, np.ndarray) – Stings to use as channel labels in the plot. Must match length of channels being displayed.
colors (list) – Color palette or list of colors to use for channels.
fig_size (list, tuple, np.ndarray) – The size of the matplotlib figure to plot axis on if axis=None.
show (bool, str) – String ‘notebook’ to plot interactively in a jupyter notebook or boolean value indicating if the plot should be displayed.
- Returns
If show is False, returns a matplotlib axis. Otherwise, plots the figure and returns None.
- Return type
matplotlib.axis.Axis, None
- plot_channel(channel, parameters, *args, method='mean', axis=None, x_lim=None, y_lim='auto', colors=sns.color_palette(), fig_size=(10, 3), show=True, **kwargs)
Plots the data from a channel for the given stimulation parameters. Plotting occurs over the time interval of one pulse period, starting at 0 seconds. Plotting uses either the mean or median of each data point across all pulses.
- Parameters
channel (str, int) – Channel or channel index to be plotted.
parameters (tuple, list) – Stimulation parameter or list of parameters.
args (*) – See mpl.axes.Axes.plot for more information.
method (str) – Use ‘mean’ to plot the mean values and ‘median’ to plot the median values.
axis (None, matplotlib.axis.Axis) – Either None to use a new axis, or a matplotlib axis to plot on.
x_lim (None, list, tuple, np.ndarray) – None to plot the entire data set. Otherwise tuple, list, or numpy array of length 2 containing the start of end times for data to plot.
y_lim (None, str, list, tuple, np.ndarray) – None or ‘auto’ to automatically calculate reasonable bounds based on standard deviation of data. ‘max’ to plot y axis limits encompassing all accessible data. Otherwise tuple, list, or numpy array of length 2 containing limits for the y axis.
colors (list) – Color palette or list of colors to use for the plot.
fig_size (list, tuple, np.ndarray) – The size of the matplotlib figure to plot axis on if axis=None.
show (bool) – Set to True to display the plot and return nothing, set to False to return the plotting axis and display nothing.
kwargs (**) –
See mpl.axes.Axes.plot for more information.
- Returns
If show is False, returns a matplotlib axis. Otherwise, plots the figure and returns None.
- Return type
matplotlib.axis.Axis, None
Examples
>>> ecap_data.plot("RawE 1", (0,0))
- plot_raster(channel, parameters, *args, method='mean', axis=None, x_lim=None, c_lim='auto', c_map='RdYlBu', fig_size=(10, 4), show=True, **kwargs)
Generates a raster plot for a given channel and parameters.
- Parameters
channel (str) – Channel to be plotted.
parameters (list) – List of stimulation parameters.
args (*) – See mpl.axes.Axes.imshow for more information.
method (str) – Use ‘mean’ to plot the mean values and ‘median’ to plot the median values.
axis (None, matplotlib.axis.Axis) – Either None to use a new axis or matplotlib axis to plot on.
x_lim (None, list, tuple, np.ndarray) – None to plot the entire data set. Otherwise tuple, list, or numpy array of length 2 containing the start of end times for data to plot.
c_lim (str) – ?? Limits for color map??
c_map (str, matplotlib.color.Colormap) – Color map.
fig_size (list, tuple, np.ndarray) – The size of the matplotlib figure to plot axis on if axis=None.
show (bool) – Set to True to display the plot and return nothing, set to False to return the plotting axis and display nothing.
kwargs (**) –
See mpl.axes.Axes.imshow for more information.
- Returns
If show is False, returns a matplotlib axis. Otherwise, plots the figure and returns None.
- Return type
matplotlib.axis.Axis, None